Execution Log
The Execution Log is a built-in monitoring and debugging tool in Studio. It allows you to track the history of your flow runs, check their success or failure statuses, and inspect the exact data payloads passed between each step of your integration.
Access to Execution Log
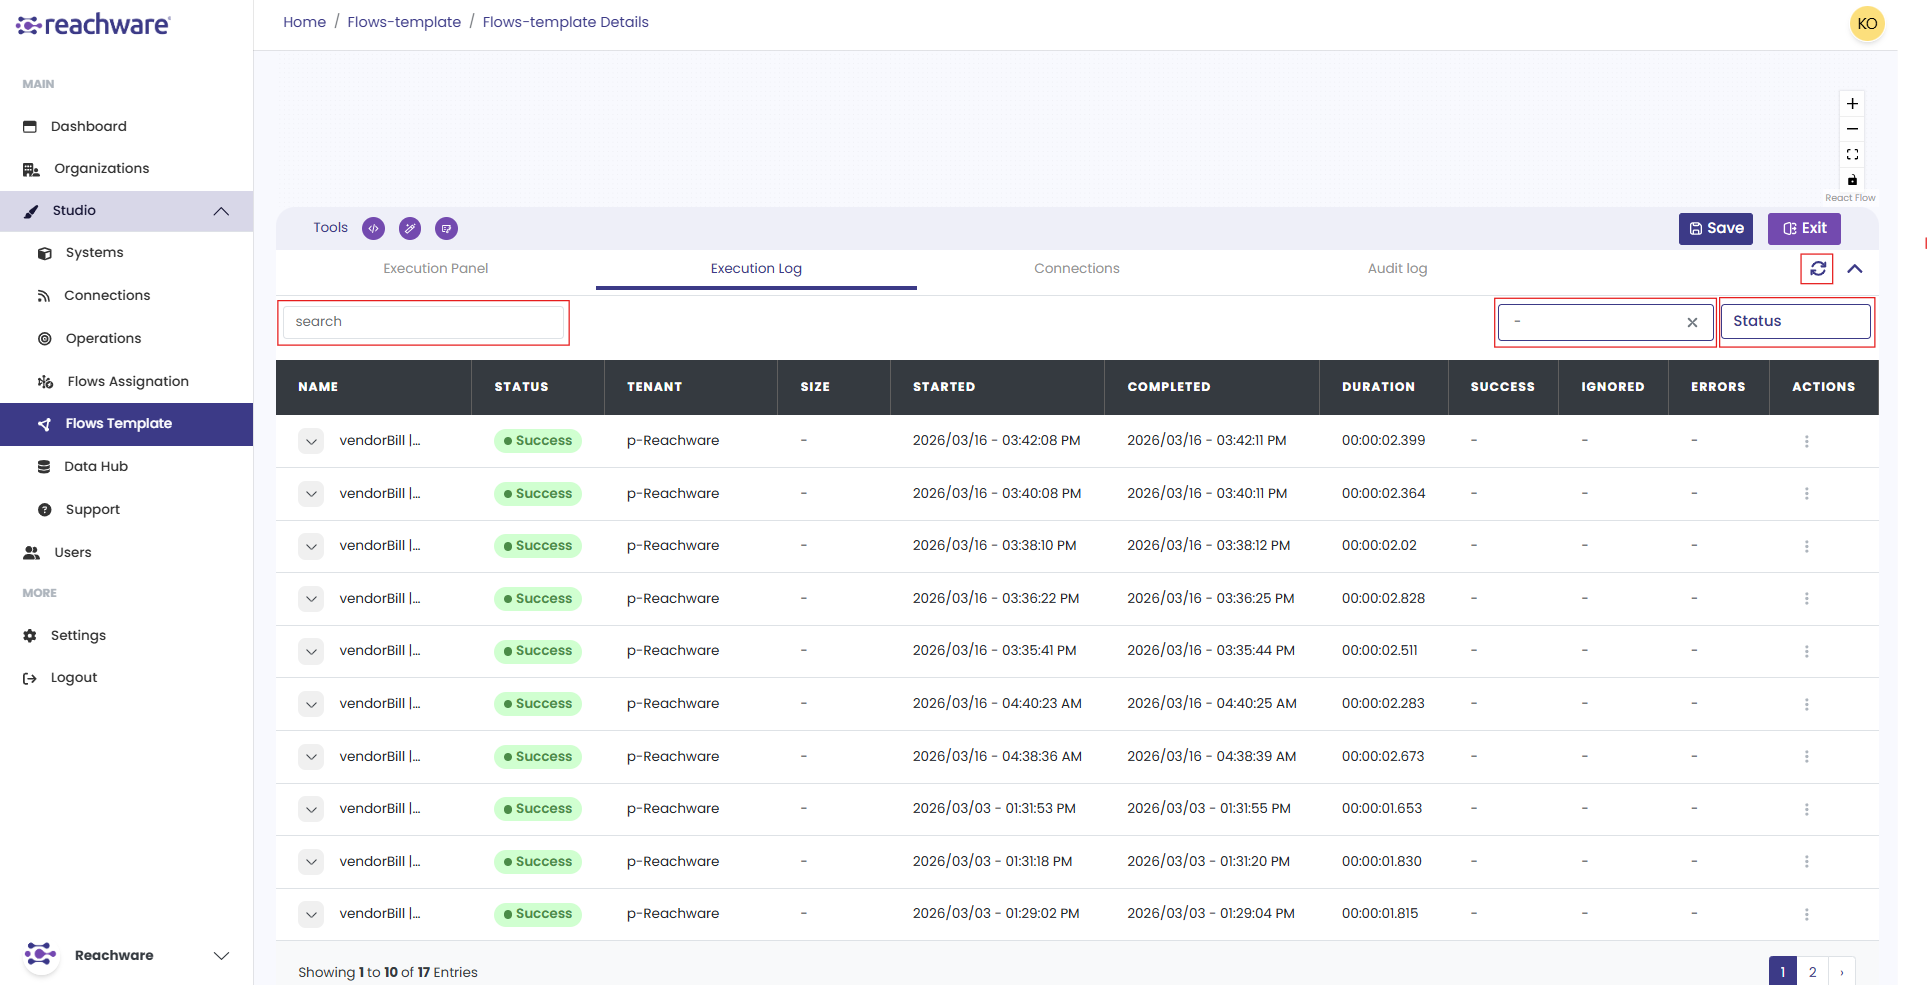
While viewing your Flow Template, look at the bottom control bar and click the Execution Log tab.

Searching and Filtering Runs
When you open the log, you will see a main table listing all recent executions. Use the tools at the top of the panel to narrow down the list:
| Tool | Description |
|---|---|
| Search Bar | Type specific keywords to quickly find a particular flow run |
| Date Picker | Filter the logs by a specific date or a custom time range |
| Status Filter | Filter by outcome: ● Success● Warning● Cancelled● In progress● Failed |
| Refresh | Click the circular arrow icon to instantly update the table with the most recent runs |
Find a Specific Run by Execution ID
To copy an Execution ID from an existing run, click the three-dot (⋮) menu on the transaction and select Execution ID. A confirmation appears once it's copied to your clipboard.
Flow Execution Details
Each row in the table represents one execution run. Here is what each column means:
| Column | Description |
|---|---|
| Name | The flow step or trigger that executed |
| Status | Result of the run: Success, Failed, Warning, Cancelled, or In progress |
| Tenant | The environment the flow ran in |
| Size | Size of the data processed in this run |
| Duration | Total time taken to complete the run |
| Success | Number of records processed successfully |
| Ignored | Number of records skipped during execution |
| Errors | Number of records that failed during execution |
| Actions | Click View Data to inspect the input and output of each loop |
Inspecting Step-by-Step Details
To see exactly what happened during a specific run:
Click on any row in the main transaction to expand it.
A detailed breakdown will appear, listing every individual step that occurred within that run.
You can see the individual Status, Duration, and Error count for each node in the chain.
Input & Output Data
It allows you to see the exact data that was sent and received by each system.
In the expanded step-by-step view, locate the step you want to inspect and click View Data on the right.
A side panel will open displaying the data payload, split into Input (data sent to the node) and Output (data returned by the node).
Click the download icon at the top right of the panel to save the Input or Output JSON files to your computer for further analysis.
Cancelling a Running Transaction
Sometimes you spot a problem while a flow is still running, wrong mapping, bad input, or the target system is acting up. Instead of waiting for it to finish or fail on its own, you can stop it on the spot.
On any transaction with the status In progress, open the three-dot (⋮) menu and choose Cancel Transaction. Confirm the action, and the run stops immediately. Works for all triggers, manual, scheduled, and webhook-based.
Cancellation is immediate, any step already in progress is interrupted, which may leave partial updates in the destination system. Check the affected records before re-running the flow.
Related Topics